
One of the most important reasons why businesses visualize data is to improve their understanding of what is going on with the business and make better decisions. However, the graphs and tables presented at business meetings cannot drive concrete action without a key understanding of their purpose, context and implications.
Data storytelling provides an effective way for anyone to share data in their organization in a compelling and engaging manner to achieve a predetermined outcome. This post is the first in a series of articles that will provide the foundation for readers to understand and apply data storytelling in their work.
Why is Data Storytelling Important?
1. By presenting visuals in a compelling and engaging manner, data storytelling engages several parts of the brain. This makes it easier for decision-makers to remember the critical data points when it is time to make decisions.
2. Data on its own can be overwhelming and difficult to interpret. By using data visualization and storytelling techniques, we can create a narrative that connects data points and highlights key trends and insights.
3. Effective data storytelling can also increase engagement and buy-in from stakeholders. When presented with data in a compelling way, decision-makers are more likely to understand the importance of data-driven decision-making and to take action based on the insights presented.
4. Effective data storytelling helps build credibility and positions the presenter as a thought leader.
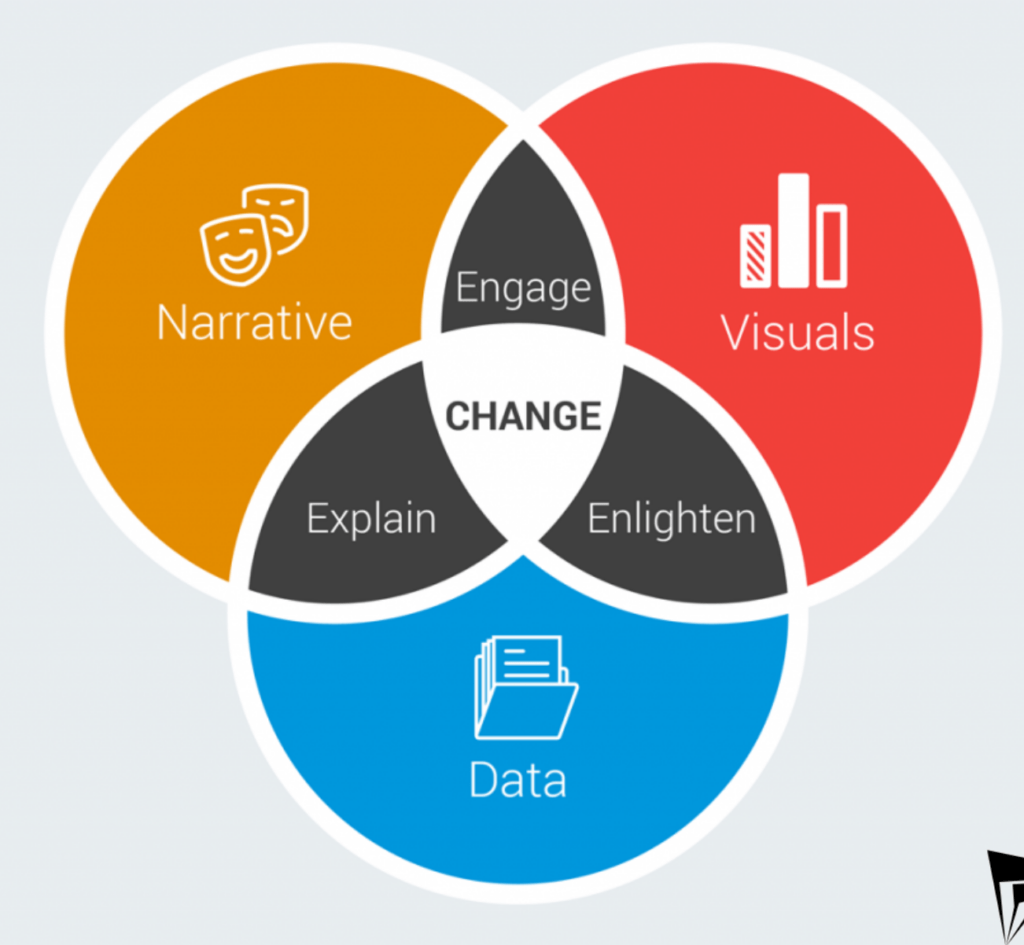
Elements of Data Storytelling
By using narratives, visuals and evidence, data storytelling provides a structured approach to presenting data and communicating insights.
Narratives: Narratives provide the structure for data stories. They form the context needed to understand data stories. They also include a well-planned sequence of ideas that serve as a pathway for consumers of data stories to progressively understand the data points, insights, and recommended actions contained in the story.
Visuals: Visuals – such as charts, and graphs – provide an effective way to display and consume several data points. Choosing the right visual can enhance the insights provided and reveal other insights that may otherwise have been hidden.
Evidence: Evidence, in the form of tangible data, supports the narrative and provides justification for the recommended actions.
Real-World Examples of Data Storytelling
Let’s take a look at some real-world examples of compelling data storytelling.
Oxfam’s annual impact report tells an engaging story about the efforts they made during the year in review and the results achieved. Using web technologies, Oxfam provides an avenue for stakeholders and the general public to understand their efforts at driving change across the globe.
Hans Rosling’s Gapminder is another great example of data storytelling. Rosling was a Swedish physician and statistician who used data visualization to tell compelling stories about global health and development. Rosling’s presentations used interactive visualizations to illustrate complex data in a way that was easy to understand. Rosling’s TED Talks on global population growth and income inequality are excellent examples of effective data storytelling.
Data storytelling is an important skill for all knowledge workers in the 21st century irrespective of their role and level of expertise in data analytics. For the workers who are not data scientists, a key understanding of the available data, the insights they can yield and the proper selection of visuals can improve communication skills and convince decision-makers to implement the recommended actions. For experienced data analysts, good data storytelling skills are needed to provide value to business units that lack extensive data analytics resources.
It is no secret that good data storytelling means creating good visualizations, read our blog post on creating better dashboards.
If you want help with converting your reports and dashboards to engaging data stories, click here.


Comments are closed.